


Last updated:

Junior Content Creator
Harvey Hunter
Junior Content Creator
Harvey Hunter
Share


Over the past 24 hours, the Bitcoin price has made another key advancement, pushing past the resistance at $69,000, though it has since retraced. One analyst, however, thinks the push could go much further, noting a breakout from a multi-month downtrend in its early stages.
This surge adds to Bitcoin’s recent strides, up 10.23% since last Monday. The much-heeded “Uptober” sentiment seems to be living up to its promise with this late-month breakthrough, as altcoins ride the wave alike.
Indeed, Bitcoin appears to be a hot commodity among investors. Trading volume has doubled over the past 24 hours, nearing $28 billion. Meanwhile, Bitcoin futures have hit an all-time high of $40.5 billion – investors seem to be committed to this uptrend.
Analyst Cautions Major “Retest” in Progress
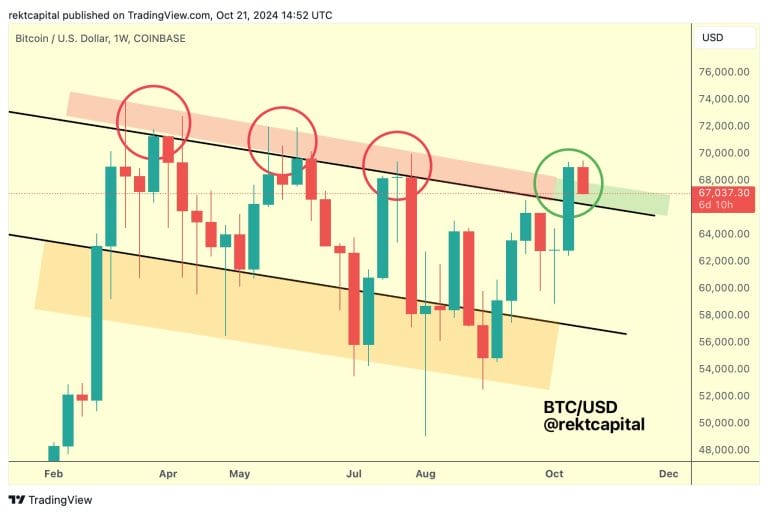
In an ongoing string of X posts, influential pseudonymous trader Rekt Capital highlighted significant developments on the Bitcoin chart, highlighting a critical inflection point.

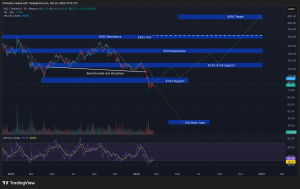
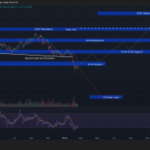
Bitcoin is currently vying to validate a breakout from a seven-month consolidation range after surpassing the resistance of its upper bound.
While the analyst expressed optimism this resistance could flip to provide new support, they cautioned that the Bitcoin price could “dip just a little bit deeper into the general green area for additional buy-side liquidity” to steady its footing.
Though this does leave room for a false flag, his takeaway was bullish, proclaiming that the downtrend was “finally over” with a decisive weekly close out of the range.
Zooming out, the analyst noted this as one chapter in a wider bullish narrative. Citing past halving cycles, they suggested that Bitcoin is likely to see higher prices, with the bull market not even halfway through.
Following this historic trend, they set a price target, projecting a zone between $80,000 and in excess of $160,000, exclaiming, “We will be there.”
Bitcoin Price Analysis: How High Can the Breakout Go?
Although Rekt Capital sets a strong case for Bitcoin’s long-term appreciation, his analysis begs the question of how high Bitcoin can really go.
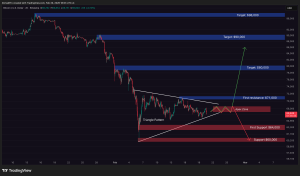
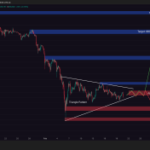
Upon closer inspection, the Bitcoin price chart seems to heed answers, revealing that this multi-month downtrend may be a consolidation zone within a wider bullish flag pattern.

This represents a temporary pause in a prevailing sharp uptrend, suggesting that Bitcoin could enter a parabolic rally with a target of around $86,000 if the pattern materializes – potentially by the year’s end.
While the breakout has been met with a correction, the analyst’s hypothesis seems credible, with a potential bottom as low as the $66,500 mark before Bitcoin holds steady.
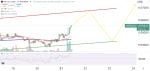
Most notably, the MACD line has affirmed a crossover above the signal line with last week’s close, a move which, historically, has led to significant upticks in the Bitcoin price. This may just be a cooldown for Bitcoin before it mounts its next rise.
This Low Cap Gem Has Higher Gains Potential
Although this certainly rings bullish for the world’s leading cryptocurrency, fortune favors the bold – emerging opportunities that hold the potential for truly substantial gains.
As “meme coin supercycle” sentiment takes hold and coins like $GOAT and $MOODENG experience sudden rises to prominence, strategic investors may find it beneficial to diversify into newer low-cap meme coins with exponential growth potential.
One such coin is Pepe Unchained ($PEPU), a meme coin that transcends conventional utility. It tackles two of the most significant pain points in the current crypto landscape: transaction speeds and fees.
This liberated evolution of Pepe operates on its own Layer 2 chain, freeing itself from Ethereum’s shackles, offering lower fees and 100x faster transaction speeds.
It’s not just a meme coin, it’s a meme chain! Something that may be credited to its instant success, raising over $21 million in its presale so far!
This confidence can also be attributed to Pepe Unchained’s commitment to transparency. It has undergone two audits and features its own block explorer, allowing users to track all transactions on its unique chain.
At a temporary fixed presale price of $0.0115, those who act quickly stand to benefit the most. Investors are currently earning an impressive 105% APY. This presents a valuable passive income opportunity, even amidst recent market volatility.
Join the Pepe Unchained community on X and Telegram to stay up to date on the latest announcements.
Disclaimer: Crypto is a high-risk asset class. This article is provided for informational purposes and does not constitute investment advice. You could lose all of your capital.